Google Analytics provides very detailed analytics for your website; but there is always room for more. People who use (or have used) traditional web analytics software such as AWStats, Analog and Webalizer are familiar with the "days of week" and "rush hour" reports, neither of them are directly available in Google Analytics.
The traffic for a website vary by day of week and it is very useful to know when a website expects most (or least) visitors. Sometimes these statistics help you make decisions such as when to launch a promotion or take down a website for maintenance.
Day of Week Report
You can create day of week report in the Custom Reporting section. From this section, click the New Custom Report button and follow the instructions below:
- Enter a suitable title for your report.
- Enter a suitable name for the first tab.
- Select the Flat Table type.
- Click the add dimension button and select Other > Day of week (do not confuse this with the Week of year dimension).
- Click the add metric button and select Visitors > Visits. You can add as many metrics as you like.
Click Save to save your report and choose a suitable date range to view the results. Note that the number of days represented by the chosen date range should be a multiple of seven to avoid biased results. For example, if the first date is a Sunday then the last date must be a Saturday.
The number 0 in the day of week column represents Sunday, 1 represents Monday and so on. The sample report above shows that that most visits occurred on Wednesdays for the chosen date range; while Saturdays had the least of visits.
Hour of Day Report
The hour of day custom report can be created in a similar manner:
- Edit the report you just created and click the add report tab button. Or you can create a new report instead.
- Enter a suitable name for the new tab.
- Select the Flat Table type.
- Click the add dimension button and select Other > Hour (do not confuse this with Hour of day dimension).
- Click the add metric button and select Visitors > Visits. You can add as many metrics as you like.
Click Save to save your report and choose a suitable date range to view the results.
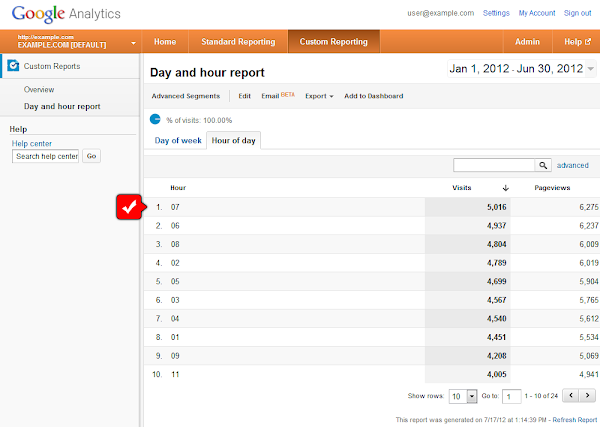
The numbers 00-23 in the hour column represent hour of the day in the timezone configured for the account. Note that this is not the visitor or server's local time; it is the visit's time converted (and DST corrected) to the timezone configured for the Google analytics profile. The sample report above shows that most visits occurred at around 7AM for the chosen date range. FYI, the account is configured to display GMT-08:00.


